
Key takeaways
- Productive efficiency occurs when your facility produces goods at the lowest possible cost, using all available resources without waste.
- Unplanned downtime, deferred maintenance, and disengaged labor are the primary drivers of productive inefficiency in manufacturing.
- Productive efficiency addresses how you produce goods, while allocative efficiency addresses what goods you produce. Both matter for sustained profitability.
- Preventive maintenance (PM), lean manufacturing, and a well-implemented computerized maintenance management system (CMMS) are the most direct levers for improving productive efficiency on the plant floor.
- Facilities that track productive efficiency alongside metrics like overall equipment effectiveness (OEE) and capacity utilization have the clearest path to reducing costs and improving throughput.


Productive efficiency is one of the most actionable concepts in operations management, but one of the least understood outside of economics textbooks. For plant managers and operations leaders in asset-intensive industries, it represents the gap between what your facility currently produces and what it could produce with the same resources.
This article explores what that gap looks like in practice and how to close it.
What is productive efficiency?
Productive efficiency is achieved when a facility produces goods at the lowest possible cost, using all available resources without waste. When operations reach this standard, it becomes impossible to increase the output of one product without reducing the output of another. At this point, every input is fully committed with no room for more.
In economic terms, productive efficiency is reached when marginal cost equals average cost (MC = AC). This is the point where the cost of producing one additional unit matches the average cost across all units. For operations leaders, this means your facility is producing at maximum output without driving up per-unit costs.
For plant managers and VPs of operations in asset-intensive industries, productive efficiency translates into the gap between what your facility currently produces and what it should be producing. It captures whether your production lines run at maximum capacity without wasting labor, materials, or equipment availability.
A higher rate of production efficiency lowers your cost per unit and strengthens your competitive position. High productive efficiency also helps manufacturers reduce resource consumption during periods of supply chain pressure and deliver a more consistent product to customers.
Productive efficiency vs. allocative efficiency
While productive efficiency focuses on how goods are produced, allocative efficiency focuses on what goods are produced. Both matter for sustained profitability. Knowing which one you're actually solving for keeps you from improving the wrong thing.
A facility can run productively efficient lines—minimizing waste and hitting output targets—while still lacking allocative efficiency if it manufactures products the market no longer demands.
Running lean lines that produce the wrong products isn't efficient. It's just organized waste.
How to calculate productive efficiency
Production efficiency is calculated by dividing the actual output rate by the standard output rate and multiplying that figure by 100.
Production Efficiency = (Actual Output Rate / Standard Output Rate) x 100
The actual output rate is what your facility produces in a defined period of time. The standard output rate is the production goal your team sets as the benchmark for maximum achievable output under normal conditions.
For example, if your standard output rate for one line over the course of a month is 60,000 and the actual output is 51,000, your production efficiency is 85%.
Track it over time and you'll see quickly whether your process changes are actually moving the number. You can also run this calculation for manual and automated work independently, which is useful for pinpointing exactly where capacity is being left on the table.
Production possibility frontier
The productive efficiency metric functions as a benchmark for improvement and a broader planning tool, particularly when facilities need to evaluate trade-offs across more than one product or process.
The production possibility frontier (PPF), also called the production possibility curve or transformation curve, shows the combinations of goods a facility can produce with its current resources and technology.
Each point on the PPF curve represents a different production scenario:
- Points on the curve: Your facility is productively efficient, fully using available resources.
- Points inside the curve: Your facility is operating below capacity with resources being wasted.
- Points outside the curve: Your facility cannot reach this output with current assets. Additional capital or technology is required.
The PPF cost curve serves as a practical planning tool for operations leaders evaluating their facility's product mix, whether in domestic production or international supply chain contexts. Some engineering and reliability teams also deploy data envelopment analysis or the Farrell measure as a complementary diagnostic tool for benchmarking efficiency across multiple facilities.
What causes productive inefficiency in manufacturing?
The gap between actual and standard output on a high-volume production line rarely has a single cause. Several operational conditions routinely push facilities below their productive efficiency threshold, and most are preventable with the right maintenance strategy and resource allocation practices.
- Unplanned downtime: When critical equipment fails unexpectedly, production halts while fixed costs continue to accumulate. Every hour of unplanned stoppage directly reduces the actual output rate and drives the productive efficiency score down.
- Deferred maintenance: Skipping or delaying routine inspections often results in machines running at reduced speeds, scrap, or rework, which wastes raw materials and lowers overall yield without a visible single-point failure.
- Outdated tracking systems: Facilities that rely on paper-based work orders or spreadsheets lack the visibility needed to identify bottlenecks as they form. Without live data on asset health and maintenance activity, operations teams cannot make proactive decisions before small inefficiencies compound into major production losses.
- Poor resource allocation and accessibility: Disorganized parts inventory and inefficient shift scheduling force technicians to spend time searching for tools and components rather than completing maintenance tasks, which increases mean time to repair and extends equipment downtime.
- Low workforce engagement: A disengaged workforce is less likely to follow procedures accurately, flag emerging issues early, or maintain the pace needed to hit standard output rates.

79% of teams saw the amount of unplanned downtime stay the same or increase over the past year, and 39% say the cost of downtime is rising.
How to improve productive efficiency
The higher your productive efficiency (PE) score, the better your manufacturing operation is performing. PE is a metric that should be actively measured and improved for a facility to:
- Continually improve resource usage
- Improve economies of scale
- Build and sustain competitive advantages in the market
These are the strategies that move the number fastest.
Increase productive efficiency with equipment maintenance
Unexpected equipment outages can completely derail production and erode profitability. When manufacturers invest in preventive maintenance, the majority of asset breakdowns, along with their downstream production consequences, are avoided before they occur.
Teams that track equipment downtime patterns gain the data needed to shift from reactive repairs to proactive interventions.
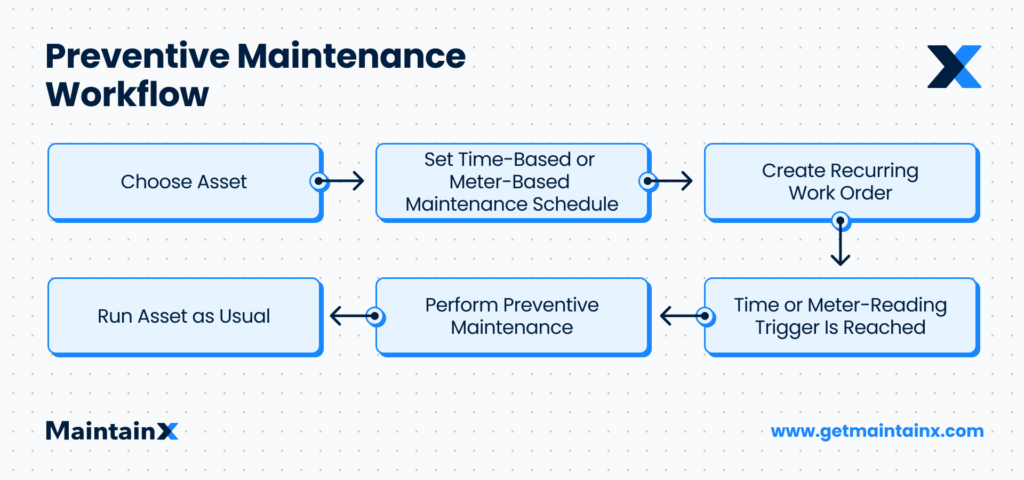
Just as fleet operators schedule oil changes and multi-point inspections to prevent roadside failures, manufacturers place critical equipment on structured PM schedules to prevent the unplanned breakdowns that directly cut into production output.
MaintainX customers report an average 32% reduction in unplanned downtime after moving from reactive maintenance to automated PM scheduling. For a facility averaging four hours of unplanned downtime per week, that reduction translates to more than 65 recovered production hours per year without adding equipment or headcount.
Engage the workforce
Resources in manufacturing extend beyond equipment and raw materials. The workforce is equally critical to productive efficiency. Studies show that only about a quarter of shop-floor workers feel engaged with their duties while on the job, compared to roughly 36% engagement across all U.S. workers.
Manufacturing companies also report an average turnover rate of around 20%, which erodes the institutional knowledge that experienced technicians carry. In a maintenance environment, where procedural accuracy and early fault detection directly affect equipment uptime, that knowledge gap has a measurable impact on your PE score.
An engaged and satisfied workforce is far more likely to follow procedures accurately, flag emerging equipment issues early, and maintain the output rates that define productive efficiency. Facilities that actively invest in technician development retain experienced staff and build the organizational knowledge that prevents the same inefficiencies from recurring.
Get lean
Lean methodology provides a structured framework for reducing waste and improving efficiency across the shop floor. Lean manufacturing practices, like Six Sigma, Kaizen, and just-in-time manufacturing, require an upfront investment in training and change management. The gains that follow aren't one-time wins — they lower your cost per unit and stabilize output across shifts.
Optimize the manufacturing plant floor
From inventory management to facility layout, the physical environment of your plant floor shapes production efficiency. Stocking the right quantities of materials and spare parts ensures PM tasks are completed on schedule without parts-sourcing delays that extend equipment downtime windows.
For example, Breeze Thru used MaintainX to organize their million-dollar parts inventory and recovered four hours per week that had previously gone to manual reporting. That time went directly back into maintenance activity that keeps equipment running at rated capacity.
From a layout perspective, research shows that arranging workers and machines into cells based on production steps, rather than distributing them across the facility by function, reduces material handling time and improves throughput. Your layout, parts organization, shift handoffs all feed into the number. Productive efficiency is as much an environmental outcome as a technical one.
How a computerized maintenance management system supports productive efficiency
If unplanned downtime and incomplete maintenance data are what's pulling your PE score down, a CMMS is where you close that loop.
A field-ready CMMS platform digitizes work orders, automates PM scheduling, manages parts inventory, tracks procedure completion, and delivers up-to-the-minute data on asset health, all in one place.
When maintenance data lives in spreadsheets and paper logs, resourcing decisions come down to gut feel, and gut feel misses things that cost you production hours. A well-implemented CMMS turns your team's daily maintenance work into a live record of asset health, so when PE drops, you know exactly where to look.
MaintainX deploys in an average of three weeks per site, far faster than the months-long timelines typical of legacy systems. Cintas put that to the test by rolling out the platform across 200 sites in just nine weeks, maintaining operational continuity throughout.


Start closing the productive efficiency gap
Productive efficiency is the distance between what your facility produces today and what it should produce with the exact same resources. That gap is real, it's measurable, and most of it is recoverable. Closing that gap requires consistent preventive maintenance, engaged technicians, and real-time visibility into asset performance across every shift.
Facilities still running paper-based work orders or legacy CMMS platforms typically spend two to three times more on reactive repairs than those on structured PM programs. MaintainX was built for frontline maintenance teams in asset-intensive industries—the people who need PM schedules that actually run, parts inventory that's actually organized, and data they can act on before a breakdown costs them production time. Sign Up for Free and see how your facility can start closing the gap between current output and true productive efficiency.
Productive efficiency in manufacturing operations FAQs
How does productive efficiency differ from allocative efficiency in a manufacturing context?
Productive efficiency means your plant produces goods at the lowest possible cost, with no resources wasted. Allocative efficiency means your plant produces the exact mix of products that the market demands. Productive efficiency controls your operational cost structure, while allocative efficiency drives revenue alignment—and a profitable manufacturing operation requires both.
What is an example of productive efficiency on a manufacturing plant floor?
A facility might produce 10,000 machined components per shift. After implementing a structured PM schedule that eliminates two hours of weekly unplanned stoppage, the same facility produces those 10,000 components while consuming 15% less energy and technician labor time. The output volume stays constant, but the cost per unit drops—a direct improvement in productive efficiency.
Why is productive efficiency measured at the point where marginal cost equals average cost in manufacturing operations?
Productive efficiency is reached at the MC = AC point because that is where the cost to produce one additional unit exactly matches the average cost per unit—the lowest point on the average cost curve. Producing below this point means your facility has idle capacity, while producing beyond it means per-unit costs begin to rise. For plant managers, this benchmark helps identify whether your current production volume is leaving recoverable capacity on the table.
How does unplanned downtime affect productive efficiency for maintenance and operations teams?
Unplanned equipment failures reduce your actual output rate while fixed costs—labor, overhead, and equipment financing—continue to accumulate. Because the productive efficiency formula divides actual output by standard output, any stoppage that reduces production volume lowers your efficiency score. Structured preventive maintenance programs are the most direct way to reduce the frequency and duration of these events.
What metrics do maintenance, repair, and operations teams use to track productive efficiency across industrial facilities?
Maintenance and operations teams typically track productive efficiency alongside Overall Equipment Effectiveness (OEE), capacity utilization rate, mean time between failures (MTBF), and mean time to repair (MTTR). These metrics identify where your production process loses time, throughput speed, or output quality—giving your team the diagnostic data needed to close the gap between current performance and your productive efficiency benchmark.

Caroline Eisner is a writer and editor with experience across the profit and nonprofit sectors, government, education, and financial organizations. She has held leadership positions in K16 institutions and has led large-scale digital projects, interactive websites, and a business writing consultancy.
.webp)